The effect of columns differential height
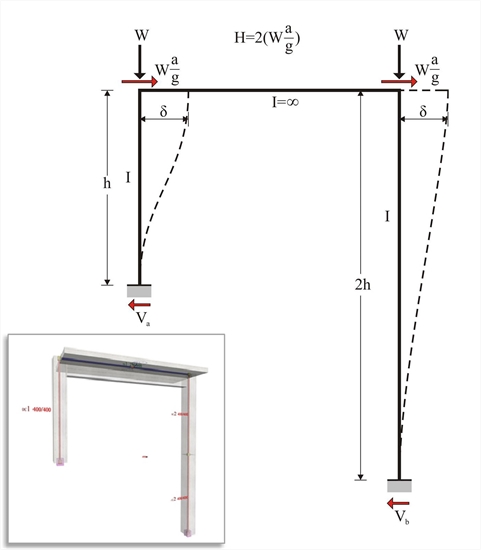 Figure 5.1.4-1: Frame of common practice, project <B_514>
 Figure 5.1.4-1: Frame of common practice, project <B_514>
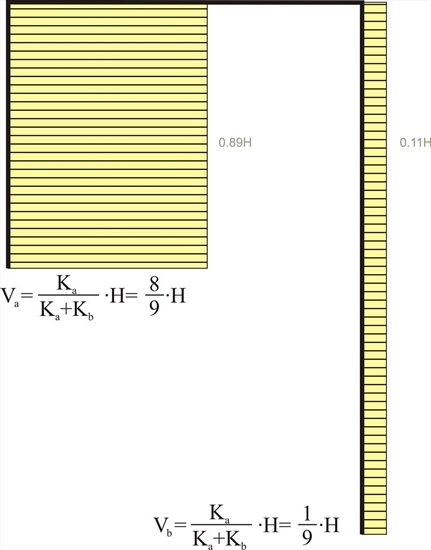 Figure 5.1.4-2: 89% of the seismic force is carried by the "short" column.
 Figure 5.1.4-2: 89% of the seismic force is carried by the "short" column.
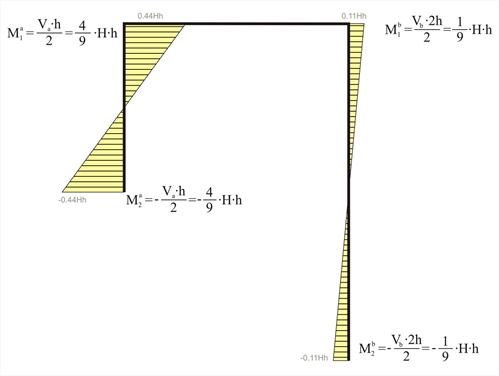 Figure 5.1.4-3: The bending moment of the "short" column is four times higher than the corresponding moment of the "tall" one.
 Figure 5.1.4-3: The bending moment of the "short" column is four times higher than the corresponding moment of the "tall" one.
I.e. 89% of the seismic shear is carried from the first (short) column.
Example 5.1.4: Consider the typical columns 400/400, and seismic acceleration factor a / g =0.10.
Total horizontal force: H = 2·(0.10·800kN)= 160 kN
Va=160 ·8 /9=142.2 kN, Vb=160 ·1 /9=17.8 kN
Ma1=-Ma2=142.2·3.0/2=213.3 kNm, Mb1=-Mb2=17.8·6.0/2=53.4 kNm
Left column stiffness: Ka=12EI/h3= 31.10·106 N / m
Right column stiffness: Kb=1.5E · I/h3=(1.5· 31.10·106 N / m )/12 =3.89 · 106 N/ m
therefore δ = H / Σ (K)=160·103N/(34.99 · 106 N/m) =4.573 mm .
Frame of common practice:
In project <B_514> of the related software, the cross-section of the left column C1 and the right column C2 are 400/400 and 800/400 respectively. Their heights are 3.00 m and 6.00 m respectively. The flanged beam cross-section is 250/500/1010/150 and its span is 5.00 m.
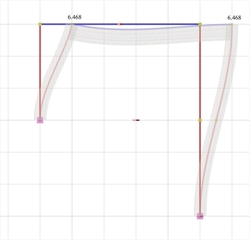 Figure 5.1.4-4: Elastic line, δmax=6.468 mm
 Figure 5.1.4-4: Elastic line, δmax=6.468 mm | 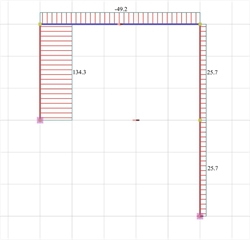 Figure 5.1.4-5: Shear force diagrams
 Figure 5.1.4-5: Shear force diagrams |
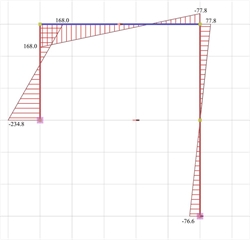 Figure 5.1.4-6: Bending moment diagrams
 Figure 5.1.4-6: Bending moment diagrams | 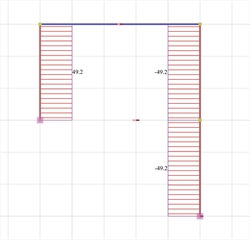 Figure 5.1.4-7: Axial force diagrams
 Figure 5.1.4-7: Axial force diagrams |
Modelling of the example with actual fixity degrees on columns i.e. those derived from the structural analysis.
It should be noted that the actual displacement δ=6.468 mm of the crossbar is somewhat higher than the theoretical value δ =4.573 mm assuming fixed end conditions. This is due to the regular cross-section of columns and mainly to the small stiffness of the right column being considerably higher.
The actual stiffness of C1 is Ka=Va/δ=(134.3·103N)/0.006468m=20.73·106 kN/m (against 31.10·106 N/m of the fixed-ended column).
The actual stiffness of C2 is Kb=Vb/δ=(25.7·103N)/0.006468m=3.97·106 kN/m (against 3.89·106 N/m of the fixed-ended column, i.e. practically the same).
Taking into account the shear effect (Shear effect=ON), the resulting displacement is equal to δ=6.634 mm (against δ =6.468 mm, i.e. the shear effect is minimum).