For both frames of the above structure, the calculation of the stress resultants subjected to static loads (dead and live) and seismic loads is required. Each frame has a span of 5.0 m and a height of 3.0 m. The moment of inertia of each column bar is I=0.4x0.43/12=0.0021333 m4=21.33x10⁻⁴m4. Τhe effective flange width of the beams is calculated according to §3.1.2: lo=0.70·l=0.70x5.00=3.50 m, b1=l n1/2=3.70/2=1.85 m, blim=bw+b1=0.30+1.85=2.15 m, beff=min(bw+beff,1, blim)=min(0.30+0.70, 2.15)=1.00 m, since beff,1=min(0.20·b 1+0.10·lo , 0.20·lo)= min(0.20x1.85+0.10x3.50, 0.20x3.50)=min(0.72 , 0.70)=0.70 m. From table 2 beff=1.0 m, hf/h=0.17/0.50=0.34, bw/beff=0.30 → μ=0.0417 → I=0.0417x1.0x0.503=52.125x10 -4 m4. According to [EC8, §4.3.1(6),(7)] the stiffnesses of structural elements (beams, columns, walls) are considered as the 50% of their respective elastic ones due to cracking. Provided that stiffnesses of all structural elements are reduced by the same factor, the stress resultants are equal to those of the elastic analysis (i.e. of full stiffnesses). However the deformations of cracked elements are equal to 50% of the respective elastic deformations. The loads on the crossbar of each frame are: Self-weight: go=0.30mx(0.50-0.17)mx25.00kN/m3 = 2.50 kN/m Dead loads on slab: gs=2.00mx5.25kN/m2 =10.50 kN/m Additional dead loads: gw =20.00 kN/m Total dead loads: g =33.00 kN/m Live load on slab: q=2.00mx5.00kN/m2 =10.00 kN/m Τhe self-weight of each column is 0.40x0.40x3.00x25.00=12.00 kN. Τhe 1/3 of this load (4.00 kN) is applied on the column head and the rest 2/3 of the load (8.00 kN), are applied on the column base. The dynamic mass of each crossbar in all seismic combinations corresponds to design load: Pd=(g+ψ2·q) ·l+2columnsx4.00kN=(33.00+0.30x10.00)x5.00+8.00=188.00 kN while the seismic force applied on each crossbar is W= (ax /g)·Pd=0.65x188.00=122.00 kN. In the following analyses implemented manually, the function of rigid bodies will not be considered. In each frame three analyses are performed, one for dead loads G, one for live loads Q and one for seismic loads in +X direction. 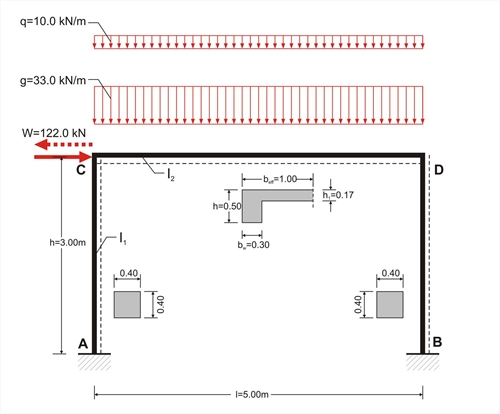 Figure 3.3.3-1: The structural model of the frame considering loadings: g and q and the seismic W
 Figure 3.3.3-1: The structural model of the frame considering loadings: g and q and the seismic W The general analysis of the frame subjected to vertical uniform load w, from table 1 is:
The general analysis of the frame subjected to horizontal load W, from table 39 is:
MA,g=-MB,g =0.60m2 x33.0kN/m=19.8 kNm MCA,g =MCD,g =MDC,g =-MDB,g =-1.20m2 x33.0kN/m =-39.6 kNm, HA,g =-HB,g =0.60m x33.0kN/m=19.8 kN, VA,g =VB,g =2.50mx33.0kN/m=82.5 kN MA,q=-MB,q =0.60m2 x10.0kN/m=6.0 kNm, MCA,q =MCD,q =MDC,q =-MDB,q =-1.20m2x10.0kN/m=-12.0 kNm, HA,q =-HB,q =0.60m x10.0kN/m=6.0 kN, VA,q =VB,q =2.50mx10.0kN/m=25.0 kN MA,W=MB,W =-0.826m x122.0kN=-100.8 kNm, MCA,W =MCD,W =-MDC,W =MDB,W =0.674x122.0=82.2 kNm, HA,W =HB,W =-0.50 x122.0kN=-61.0 kN, VA,W =-VB,W =-0.27x122.0kN=-32.9 kN The actions examined previously will be used for the calculation (a) of combinations of actions without seismic loads according to §2.3.1 and (b) of the combination of actions with seismic loads according to §2.3.2. (a) Combination of actions without seismic loads: The only combination examined is ο γg·G+ γq·Q (b) All seismic combinations are examined when the gravity loads are The two seismic combinations examined in this case, are in +x direction and in -x direction 1st combination: γg·G+ γq·Q 3rd combination: G+ ψ2·Q - "Εx" In this example ψ2=0.30 based on paragraph §2.2.3.4, γg=1.35 and γq=1.50. Therefore the combinations are expressed as follows. 1st combination : w=1.35g+1.50q=1.35x33+1.50x10.0=59.55 kN/m MA=-MB=1.35MA,g+1.50MA,q=1.35x19.8+1.50x6.0=35.7 kNm MCA=MCD=MDC=-MDB=1.35MCA,g+1.50MCA,q=-1.35x39.6-1.50x12.0=-71.5 kNm, HA=-HB=1.35HA,g+1.50HA,q=1.35x19.8+1.50x6.0=35.7 kN, VA=VB=1.35HA,g+1.50HA,q =1.35x82.5+1.50x25.0=148.9 kN VCD=w·l/2+(MDC-MCD)/l=59.55x5.0/2+(-71.5+71.5)/5.0=148.9 kN, NΑ=-VCD-1.35·(self-weight of column)=-148.9-1.35x12.0=-165.1 kN NB=VDC- 1.35·( self-weight of column)=-148.9-1.35x12.0=-165.1 kN w·l2/8=59.55x5.02/8=186.1 kNm 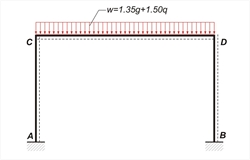 Figure 3.3.3-2
 Figure 3.3.3-2 | 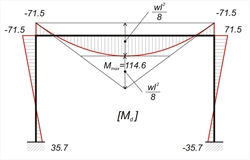 Figure 3.3.3-3
 Figure 3.3.3-3 | 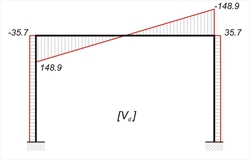 Figure 3.3.3-4
 Figure 3.3.3-4 | 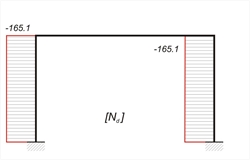 Figure 3.3.3-5
 Figure 3.3.3-5 |
2nd combination : w=g + 0.30 · q + "Εx"=33.0+0.30x10.0 + "Ex"=36.0 kN/m + "Ex" MA=MA,g+0.30MA,q+ MA,W =19.8+0.30x6.0-100.8 =-79.2 kNm, MB =-19.8-0.30x6.0-100.8 =-122.4 kNm MCA= MCD=-39.6-0.30x12.0+82.2=39.0 kNm, MDC=-39.6-0.30x12.0-82.2=-125.4 kNm, MDB=39.6+0.30x12.0+82.2=125.4 kNm, HA=HA,g+0.30HA,q+ HA,W =19.8+0.30x6.0-61.0=-39.4 kN, HB=-19.8-0.30x6.0-61.0=-82.6 kN, VA= VA,g+0.30VA,q+ VA,W =82.5+0.30x25.0-32.9=57.1 kN, VB=82.5+0.30x25.0+32.9=122.9 kN VCD=w·l/2+(MDC-MCD)/l=36.0x5.0/2+(-125.4-39.4)/5.0=90.0-33.0=57.0 kN, VDC=VCD-w · l=57.0-36.0x5.0=-123.0 kN NΑ=-VCD- self-weight of column =-57.0-12.0=-69.0 kN NB=VDC- self-weight of column =-123.0-12.0=-135.0 kN x=VCD/w=57.0/36.0=1.58 m, Mmax= MCD + (VCD·x)/2=39.0+(57.0x 1.58)/2=84.0 kNm, w·l2/8=36.0x5.02/8=112.5 kNm 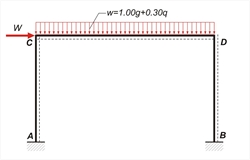 Figure 3.3.3-6
 Figure 3.3.3-6 | 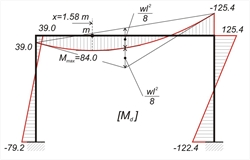 Figure 3.3.3-7
 Figure 3.3.3-7 | 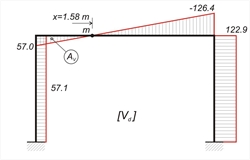 Figure 3.3.3-8
 Figure 3.3.3-8 | 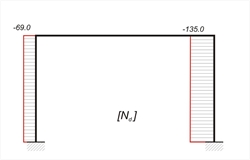 Figure 3.3.3-9
 Figure 3.3.3-9 |
3rd combination : w=g + 0.30·q - "Ε x "=33.0+0.30x10.0 - "Ex"=36.0 kN/m - "Ex" The values of stress resultants are mirror values of those of 2nd combination. 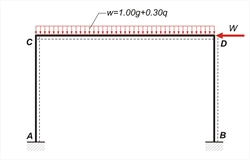 Figure 3.3.3-10
 Figure 3.3.3-10 | 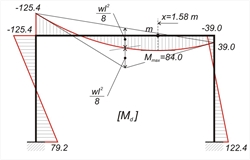 Figure 3.3.3-11
 Figure 3.3.3-11 | 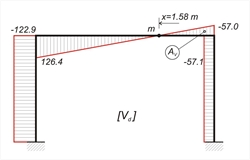 Figure 3.3.3-12
 Figure 3.3.3-12 | 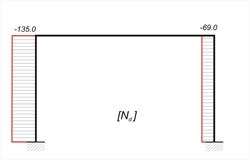 Figure 3.3.3-13
 Figure 3.3.3-13 |
Combinations and Envelopes of stress resultants .jpg?bhow=0&w=250&h=250&Str=0) Figure 3.3.3-14
Figure 3.3.3-14 Figure 3.3.3-14 | .jpg?bhow=0&w=250&h=250&Str=0) Figure 3.3.3-15
Figure 3.3.3-15 Figure 3.3.3-15 | .jpg?bhow=0&w=250&h=250&Str=0) Figure 3.3.3-16
Figure 3.3.3-16 Figure 3.3.3-16 |
Calculations performed by using the related software (project <B_331>): 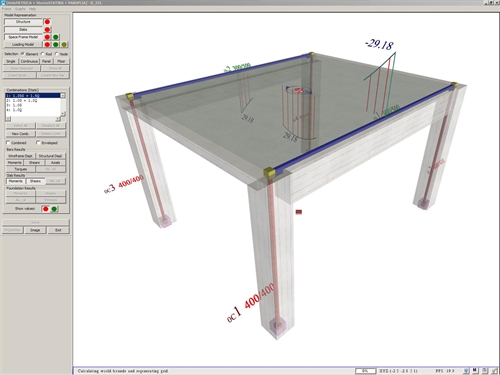 Figure 3.3.3-17: The model of the structure, created by the software, consists of slabs, nodes, bars, rigid bodies and diaphragms
 Figure 3.3.3-17: The model of the structure, created by the software, consists of slabs, nodes, bars, rigid bodies and diaphragms The moments and shears of the slab are displayed by pressing the corresponding buttons on the left of the screen. The results are the same with the theoretical results of the analysis of the previous paragraph. The model of the structure, created by the software, consists of bars, located on the centroidal axes of the columns and on the central axes at the top faces of the beams. The column-to-beam connections are modelled by rigid bodies, placed along the direction of beams. The diaphragm of the slab connects the two frames.
Τhe software displays the effective area of the slab on each frame, the total dead linear load g=34.5 kN/m and the total live linear load q=10.8 kN/m. The slightly augmented values of g and q used by the software are due to corrections made for taking into account the slab loads that extend beyond both frame ends. Τhe results of the three combinations from the software are given in the following diagrams of bending moments and shear forces (the elastic line is also shown). The small discrepancies between practical and automatic (via the software) calculations are due to the fact that the software uses rigid bodies and takes into account work done by shears and axial forces. 1st combination : 1.35g+1.50q 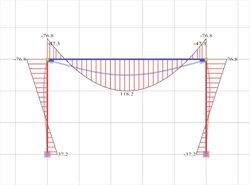 Figure 3.3.3-18:Bending moment diagram and elastic line
 Figure 3.3.3-18:Bending moment diagram and elastic line | 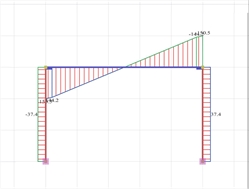 Figure 3.3.3-19:Shear force diagram
 Figure 3.3.3-19:Shear force diagram |
2nd combination : g+0.30q+EX (additional combination U1) 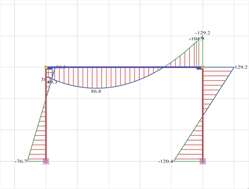 Figure 3.3.3-20:Bending moment diagram and elastic line
 Figure 3.3.3-20:Bending moment diagram and elastic line | 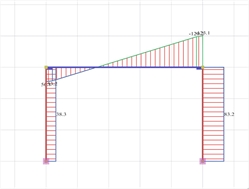 Figure 3.3.3-21:Shear force diagram
 Figure 3.3.3-21:Shear force diagram |
3rd combination : g+0.30q-EX (additional combination U2) 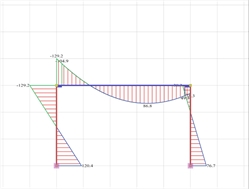 Figure 3.3.3-22:Bending moment diagram and elastic line
 Figure 3.3.3-22:Bending moment diagram and elastic line | 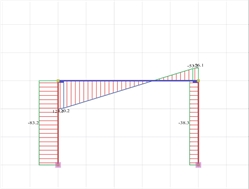 Figure 3.3.3-23:Shear force diagram
 Figure 3.3.3-23:Shear force diagram |
Combinations and Envelopes of Bending Moments 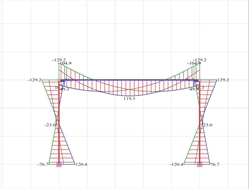 Figure 3.3.3-24:The three combinations of bending moments
 Figure 3.3.3-24:The three combinations of bending moments | 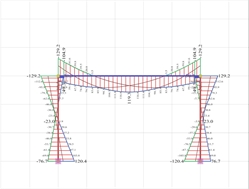 Figure 3.3.3-25: Envelope of bending moments.The values given per 0.20 m are needed for the reinforcement design and the reinforcement detailing
 Figure 3.3.3-25: Envelope of bending moments.The values given per 0.20 m are needed for the reinforcement design and the reinforcement detailing |
|