Region of three-edge- supported slabs
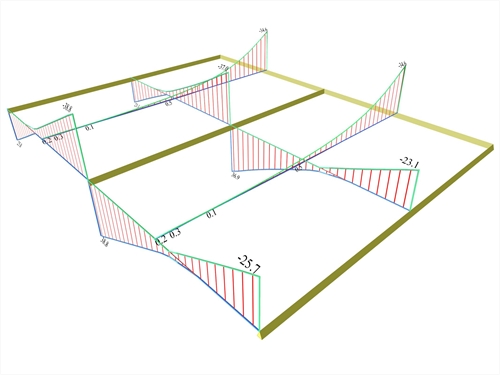 Figure 4.2.3-21: Shear force envelopes
 Figure 4.2.3-21: Shear force envelopes
The most unfavourable shear forces are equal to:
![Figure 4.2.3-22: Front view of the 3D shear force diagrams, corresponding to the envelope of [V<sub>x</sub>]](BookImagesEn2/Book-B_4230_9A.jpg?bhow=0&w=500&h=500&Str=0) Figure 4.2.3-22: Front view of the 3D shear force diagrams, corresponding to the envelope of [Vx]
Figure 4.2.3-22: Front view of the 3D shear force diagrams, corresponding to the envelope of [Vx] Figure 4.2.3-22: Front view of the 3D shear force diagrams, corresponding to the envelope of [Vx]
![Figure 4.2.3-23: Side view of the 3D shear force diagrams, corresponding to the envelope of [V<sub>y</sub>]](BookImagesEn2/Book-B_4230_9B.jpg?bhow=0&w=500&h=500&Str=0) Figure 4.2.3-23: Side view of the 3D shear force diagrams, corresponding to the envelope of [Vy]
Figure 4.2.3-23: Side view of the 3D shear force diagrams, corresponding to the envelope of [Vy] Figure 4.2.3-23: Side view of the 3D shear force diagrams, corresponding to the envelope of [Vy]
Note that although the live load has a relatively high value, the differences between the shear forces do not exceed 9%.
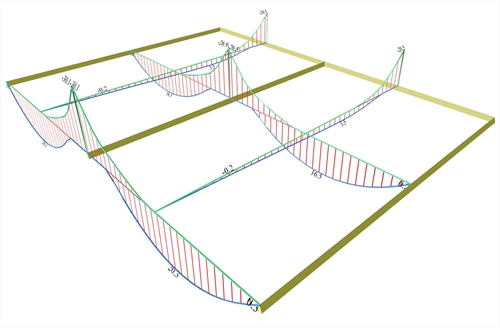 Figure 4.2.3-24: Bending moment envelopes
 Figure 4.2.3-24: Bending moment envelopes
The most unfavourable bending moments are equal to:
![Figure 4.2.3-25: Front view of the 3D bending moment diagrams, corresponding to the envelope of [M<sub>x</sub>]](BookImagesEn2/Book-B_4230_10A.jpg?bhow=0&w=500&h=500&Str=0) Figure 4.2.3-25: Front view of the 3D bending moment diagrams, corresponding to the envelope of [Mx]
Figure 4.2.3-25: Front view of the 3D bending moment diagrams, corresponding to the envelope of [Mx] Figure 4.2.3-25: Front view of the 3D bending moment diagrams, corresponding to the envelope of [Mx]
![(Fig. 4.2.3_26) Side view of the 3D bending moment diagrams, corresponding to the envelope of [M<sub>y</sub>]](BookImagesEn2/Book-B_4230_10B.jpg?bhow=0&w=500&h=500&Str=0) (Fig. 4.2.3_26) Side view of the 3D bending moment diagrams, corresponding to the envelope of [My]
(Fig. 4.2.3_26) Side view of the 3D bending moment diagrams, corresponding to the envelope of [My] (Fig. 4.2.3_26) Side view of the 3D bending moment diagrams, corresponding to the envelope of [My]
Notice that although the live load has a relatively high value, the differences between the bending moments are small.
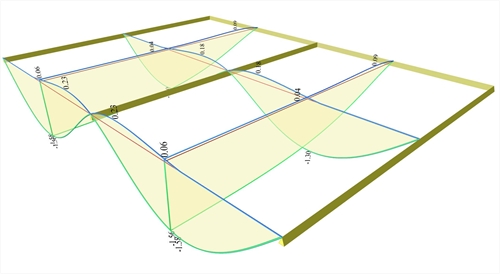 Figure 4.2.3-27: Deflection envelopes
 Figure 4.2.3-27: Deflection envelopes
In the middle cross-section of the slabs the extreme deflections are y=-1.30(- 0.94) mm and y=0.18 mm respectively.
 Figure 4.2.3-28: Front view of the 3D deflection diagrams
 Figure 4.2.3-28: Front view of the 3D deflection diagrams
 Figure 4.2.3-29: Side view of the 3D deflection diagrams
 Figure 4.2.3-29: Side view of the 3D deflection diagrams
Note that the deflections are quite higher reaching up to 40% and, at the same time, opposite sign deformations also arise (blue lines).
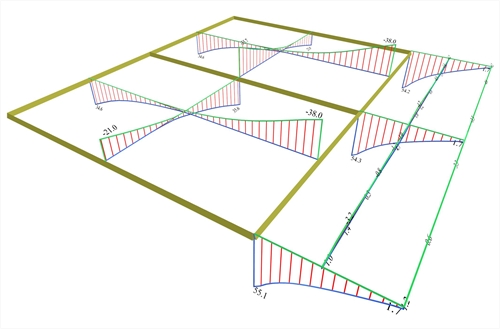 Figure 4.2.3-30: Shear force envelopes
 Figure 4.2.3-30: Shear force envelopes
The most unfavourable shear forces are equal to:
![Figure 4.2.3-31: Front view of the 3D shear force diagrams, corresponding to the envelope of [V<sub>x</sub>]](BookImagesEn2/Book-B_4230_12A.jpg?bhow=0&w=500&h=500&Str=0) Figure 4.2.3-31: Front view of the 3D shear force diagrams, corresponding to the envelope of [Vx]
Figure 4.2.3-31: Front view of the 3D shear force diagrams, corresponding to the envelope of [Vx] Figure 4.2.3-31: Front view of the 3D shear force diagrams, corresponding to the envelope of [Vx]
![Figure 4.2.3-32: Side view of the 3D shear force diagrams, corresponding to the envelope of [V<sub>y</sub>]](BookImagesEn2/Book-B_4230_12B.jpg?bhow=0&w=500&h=500&Str=0) Figure 4.2.3-32: Side view of the 3D shear force diagrams, corresponding to the envelope of [Vy]
Figure 4.2.3-32: Side view of the 3D shear force diagrams, corresponding to the envelope of [Vy] Figure 4.2.3-32: Side view of the 3D shear force diagrams, corresponding to the envelope of [Vy]
Notice that although the live load has a relatively high value, the differences between the shear forces do not exceed 6% except for the peak of the cantilever middle support reaching 15%.
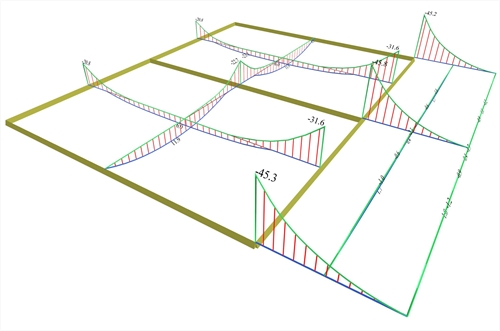 Figure 4.2.3-33: Bending moment envelopes
 Figure 4.2.3-33: Bending moment envelopes
The most unfavourable bending moments are equal to:
![Figure 4.2.3-34: Front view of the 3D bending moment diagrams, corresponding to the envelope of [M<sub>x</sub>]](BookImagesEn2/Book-B_4230_13A.jpg?bhow=0&w=500&h=500&Str=0) Figure 4.2.3-34: Front view of the 3D bending moment diagrams, corresponding to the envelope of [Mx]
Figure 4.2.3-34: Front view of the 3D bending moment diagrams, corresponding to the envelope of [Mx] Figure 4.2.3-34: Front view of the 3D bending moment diagrams, corresponding to the envelope of [Mx]
![Figure 4.2.3-35: Side view of the 3D bending moment diagrams, corresponding to the envelope of [M<sub>y</sub>]](BookImagesEn2/Book-B_4230_13B.jpg?bhow=0&w=500&h=500&Str=0) Figure 4.2.3-35: Side view of the 3D bending moment diagrams, corresponding to the envelope of [My]
Figure 4.2.3-35: Side view of the 3D bending moment diagrams, corresponding to the envelope of [My] Figure 4.2.3-35: Side view of the 3D bending moment diagrams, corresponding to the envelope of [My]
The differences between the unfavourable bending moments and the bending moments due to global loading, range from 15 to 50%.
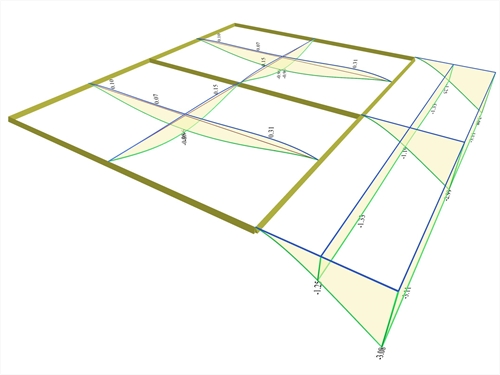 Figure 4.2.3-36: Deflection envelopes
 Figure 4.2.3-36: Deflection envelopes
In cantilever slab the maximum deflection is y=-3.11 (-2.81) mm.
 Figure 4.2.3-37: Front view of the 3D deflection diagrams
 Figure 4.2.3-37: Front view of the 3D deflection diagrams
 Figure 4.2.3-38: Side view of the 3D deflection diagrams
 Figure 4.2.3-38: Side view of the 3D deflection diagrams
The slightly fluctuating deformations of the cantilever longitudinal free edge, are due to the fluctuations of the two-way slabs deformations behind the cantilever.