|
« Unfavourable loadings and envelopes of stresses - deflections
Example 2 »
|
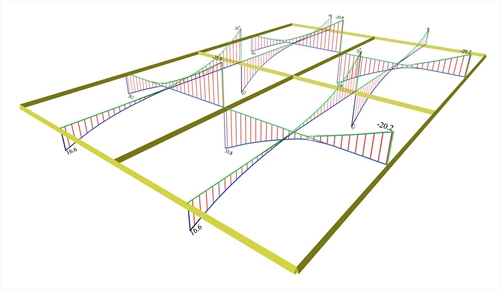
 Figure 4.2.3-3: Shear forces envelopes
 Figure 4.2.3-3: Shear forces envelopes The most unfavourable shear forces are equal to: ![Figure 4.2.3-4: Front view of 3D shear force diagrams, corresponding to the envelope of [V<sub>x</sub>]](BookImagesEn2/Book-B_4230_3A (exam-1).jpg?bhow=0&w=500&h=500&Str=0) Figure 4.2.3-4: Front view of 3D shear force diagrams, corresponding to the envelope of [Vx]
Figure 4.2.3-4: Front view of 3D shear force diagrams, corresponding to the envelope of [Vx] Figure 4.2.3-4: Front view of 3D shear force diagrams, corresponding to the envelope of [Vx] ![Figure 4.2.3-5: Side view of 3D shear force diagrams, corresponding to the envelope of [V<sub>y</sub>]](BookImagesEn2/Book-B_4230_3B.jpg?bhow=0&w=500&h=500&Str=0) Figure 4.2.3-5: Side view of 3D shear force diagrams, corresponding to the envelope of [Vy]
Figure 4.2.3-5: Side view of 3D shear force diagrams, corresponding to the envelope of [Vy] Figure 4.2.3-5: Side view of 3D shear force diagrams, corresponding to the envelope of [Vy] Note that although the live load has a relatively high value, the differences between the shear forces do not exceed 8%.  Figure 4.2.3-6: Bending moment envelopes
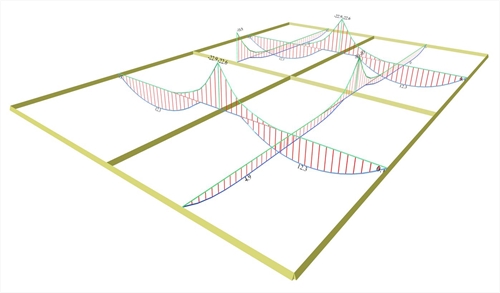
 Figure 4.2.3-6: Bending moment envelopes The most unfavourable bending moments are equal to: ![Figure 4.2.3-7: Front view of 3D bending moment diagrams, corresponding to the envelope of [M<sub>x</sub>]](BookImagesEn2/Book-B_4230_4A.jpg?bhow=0&w=500&h=500&Str=0) Figure 4.2.3-7: Front view of 3D bending moment diagrams, corresponding to the envelope of [Mx]
Figure 4.2.3-7: Front view of 3D bending moment diagrams, corresponding to the envelope of [Mx] Figure 4.2.3-7: Front view of 3D bending moment diagrams, corresponding to the envelope of [Mx] ![Figure 4.2.3-8: Side view of 3D bending moment diagrams, corresponding to the envelope of [M<sub>y</sub>]](BookImagesEn2/Book-B_4230_4B.jpg?bhow=0&w=500&h=500&Str=0) Figure 4.2.3-8: Side view of 3D bending moment diagrams, corresponding to the envelope of [My]
Figure 4.2.3-8: Side view of 3D bending moment diagrams, corresponding to the envelope of [My] Figure 4.2.3-8: Side view of 3D bending moment diagrams, corresponding to the envelope of [My] Note that although the live load has a relatively high value, the differences between the bending moments are small and less than15%.  Figure 4.2.3-9: Deflection envelopes
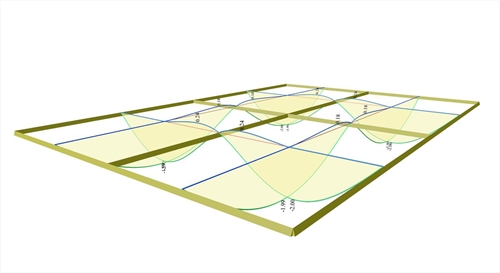
 Figure 4.2.3-9: Deflection envelopes  Figure 4.2.3-10: Front view of 3D deflection diagrams
 Figure 4.2.3-10: Front view of 3D deflection diagrams  Figure 4.2.3-11: Side view of 3D deflection diagrams
 Figure 4.2.3-11: Side view of 3D deflection diagrams Notice that the deflections are as high as 30% while opposite sign deformations also arise (blue lines).
|
« Unfavourable loadings and envelopes of stresses - deflections
Example 2 »
|

|