The effect of columns moment of inertia
In the one-bay frame of the following figure, the second column is considered having eight times higher moment of inertia than the first one. Both columns behave as fixed-ended, due to the infinite moment of inertia of the crossbar.
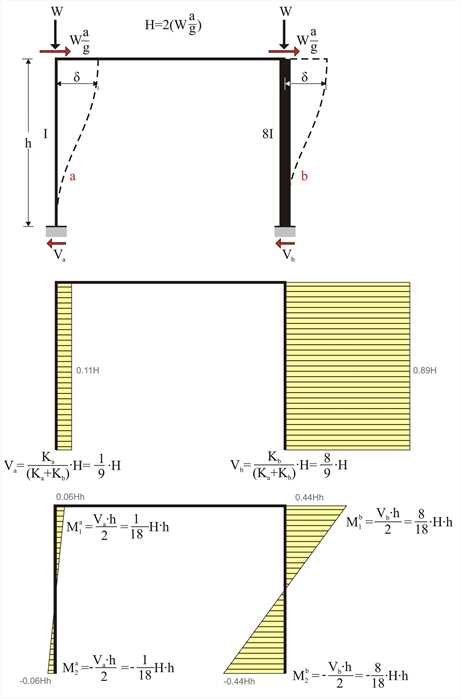 Figure 5.1.3-1: 89% and 11% of the seismic action are carried by the strong column (800/400) and the weak column (400/400) respectively
 Figure 5.1.3-1: 89% and 11% of the seismic action are carried by the strong column (800/400) and the weak column (400/400) respectively
i.e. 89% of the seismic shear is carried by the second column!
Example 5.1.3 Consider that the first column is the one of the previous example with cross-section 400/400 and that the second one differs only regarding one of its sides (800 mm instead of 400 mm with Ι 800/400 =8 Ι 400/400 ). The seismic acceleration factor of a / g =0.10.
H= 2·(0.10·800kN)= 160 kN
Va=160 ·1 /9=17.8 kN, Vb=160·8/9=142.2 kN
Ma1=-Ma2=17.8·3.0/2=26.7 kNm, Mb1=-Mb2=142.2·3.0/2=213.3 kNm
Ka=12EI/h3= 31.10·106 N/m and Kb=12E · 8I/h3=8· 31.10·106N/m =248.8 · 106 N/m
δ= H /Σ( K )=(160·103 N )/(279.9 · 106 N / m )=0.572 mm
In project <B_513> of the related software, the cross-sections of columns C1, C2 are 400/400 and 800/400 respectively and their height is equal to 3.0 m. The flanged beam has cross-section 250/500/1010/150 and span 5.0 m.
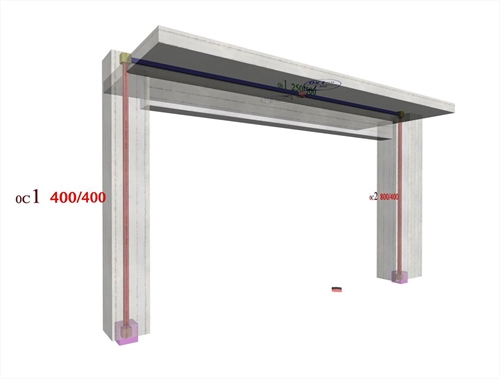 Figure 5.1.3-2: The structural frame model without rigid bodies but fully stiffened
 Figure 5.1.3-2: The structural frame model without rigid bodies but fully stiffened
The parameter values required for the relevant modelling are as follows:
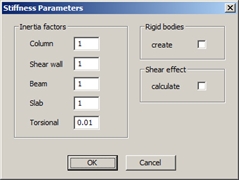 Figure 5.1.3-3
 Figure 5.1.3-3 | 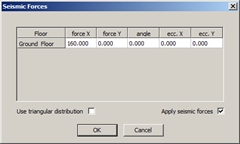 Figure 5.1.3-4
 Figure 5.1.3-4 |
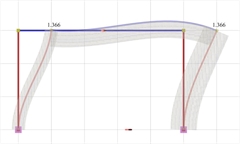 Figure 5.1.3-5: Elastic line, δmax=1.366 mm
 Figure 5.1.3-5: Elastic line, δmax=1.366 mm | 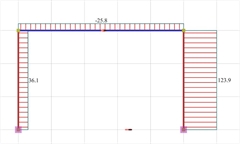 Figure 5.1.3-6: Shear force diagrams
 Figure 5.1.3-6: Shear force diagrams |
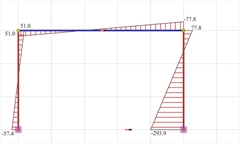 Figure 5.1.3-7: Bending moment diagrams
 Figure 5.1.3-7: Bending moment diagrams | 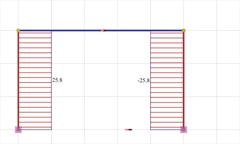 Figure 5.1.3-8: Axial force diagrams
 Figure 5.1.3-8: Axial force diagrams |
Modelling of the example with elastic degree of fixity on columns
The results are displayed using the following button sequence: "Analysis Results", "Combined"=OFF, "Combination definition" ["Delete all", "Ex"=1.0, "OK"], "Shears" ("Moments", etc.), "Show values"=ON. For more detailed results: "Printing", "Earthquake Resistant Results", "Analytical".
It should be noted that the actual displacement δ=1.366 mm of the crossbar is higher than the theoretical value δ =0.572 mm derived under the assumption of fixed end conditions. This is mainly due to the strong column and the significantly smaller stiffness of the normal beam.
The actual stiffness of C1 is Ka=Va/δ=(36.1·103N/0.00136633m)=26.42·106 kN/m (against 31.10·106 N/m of the fixed-ended column, therefore there is a relatively small difference).
The actual stiffness of C2 is Kb=Vb/δ=(123.9·103N/0.00136633m)=90.68·106 kN/m (against 248.8·106 N/m of the fixed-ended column, therefore there is a significant difference).
The behaviour of the strong column, as shown from its elastic line, approaches more the behaviour of the one-end-fixed column (stiffness 62.2· 106 N/m), than the fixed-ended one (stiffness248.8·106 N/m).
If the shear effect is taken into account (at the 'Stiffness Parameters' dialogue select Shear effect=ON), the displacement developed equals to δ=1.444 mm (against δ=1.366, therefore the effect is small).